
Analytics overview
Get access to Formant AnalyticsReach out to our Customer Success team to add the Analytics view functionality to your Formant organization. You can reach us through the Intercom messenger in the bottom-right corner of this page, or at [email protected].
Formant Analytics allows you to visualize, aggregate, and analyze data from your device over a time range of your choice. Using built-in visualizations, custom SQL queries, or our AI assistant, you can build a rich dashboard for your devices.
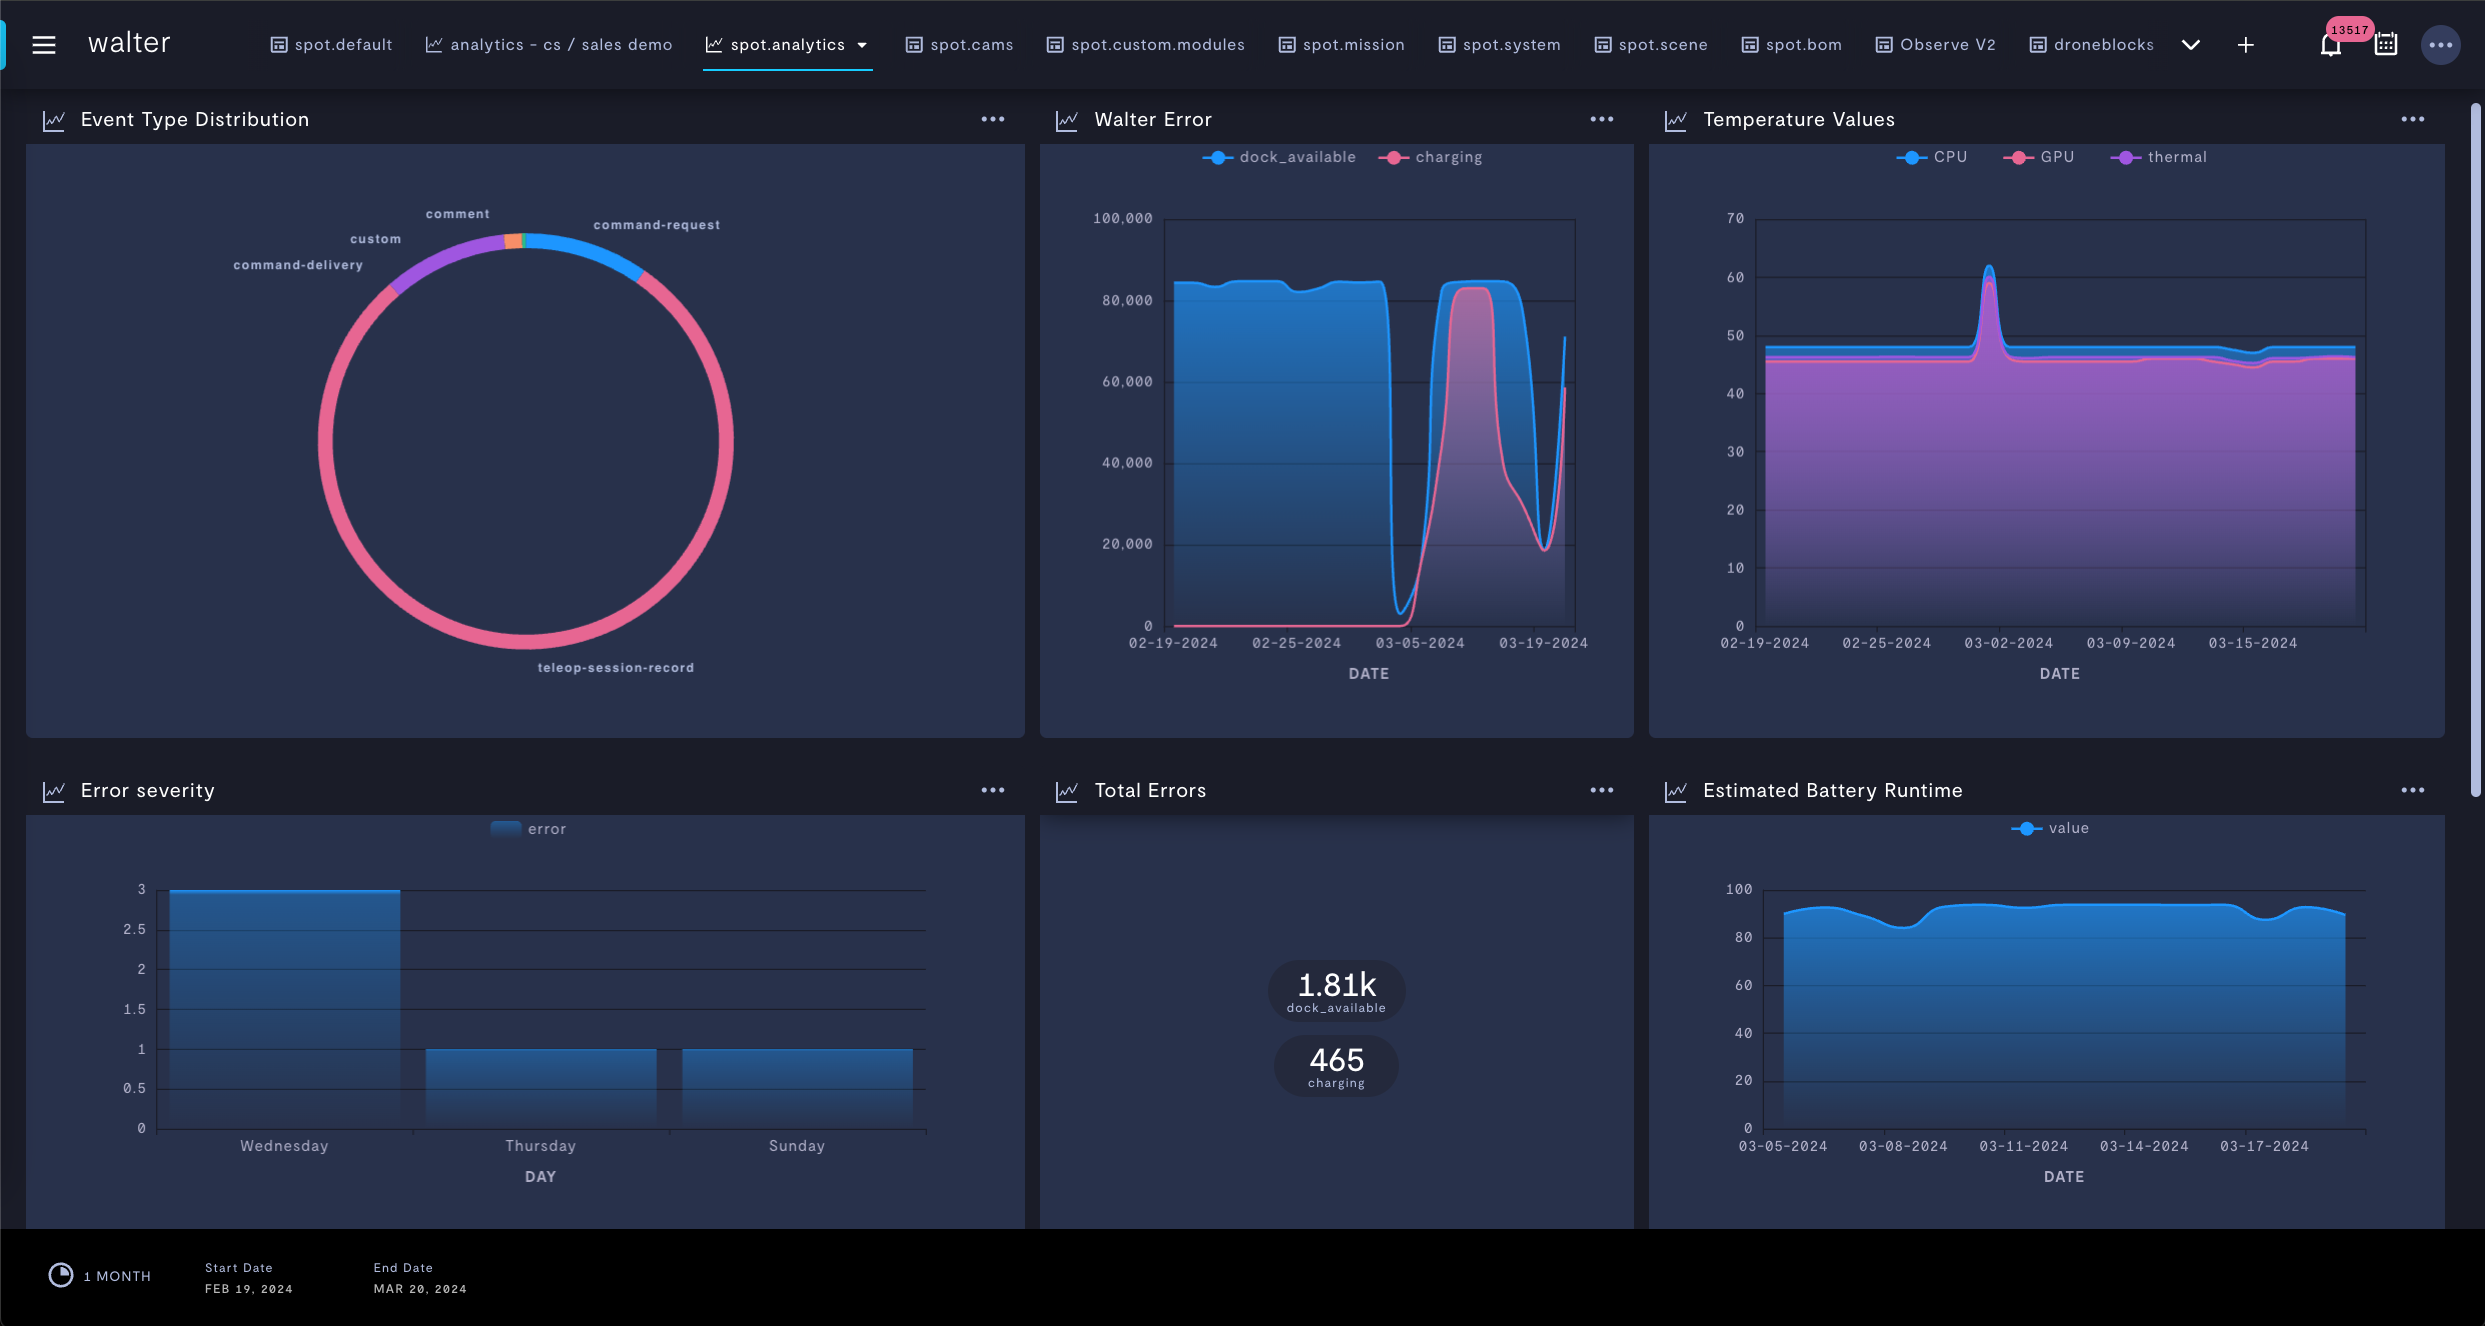
Plot data from your device using the Analytics View.
You can analyze from an individual device, or from a fleet of devices by device group or tag.
Visualizations
Formant Analytics natively supports the following data visualizations:
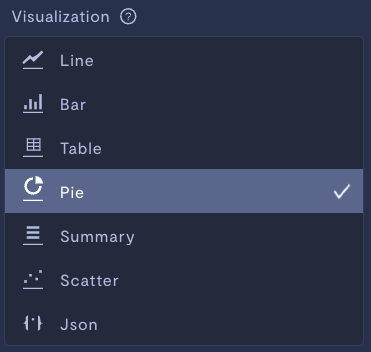
Visualization types in the Analytics view.
- Line graph
- Bar graph
- Table
- Pie chart
- Data summary
- Scatter plot
- JSON
You can plot multiple data series on a single chart.
Time range
Visualizations are plotted over the time range you select.
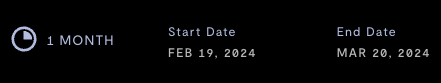
Selecting the time range to analyze.
Once you've selected your time range, you can then choose the bin size for your data.
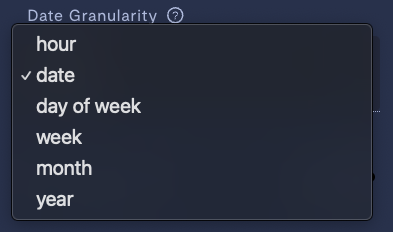
Selecting a data bin size.
Data will be binned by your date granularity, and then aggregating functions applied to each bin, over your time range.
Data sources
When selecting a data source for your visualization, you will be able to choose from available streams, events, and task summaries for your device.
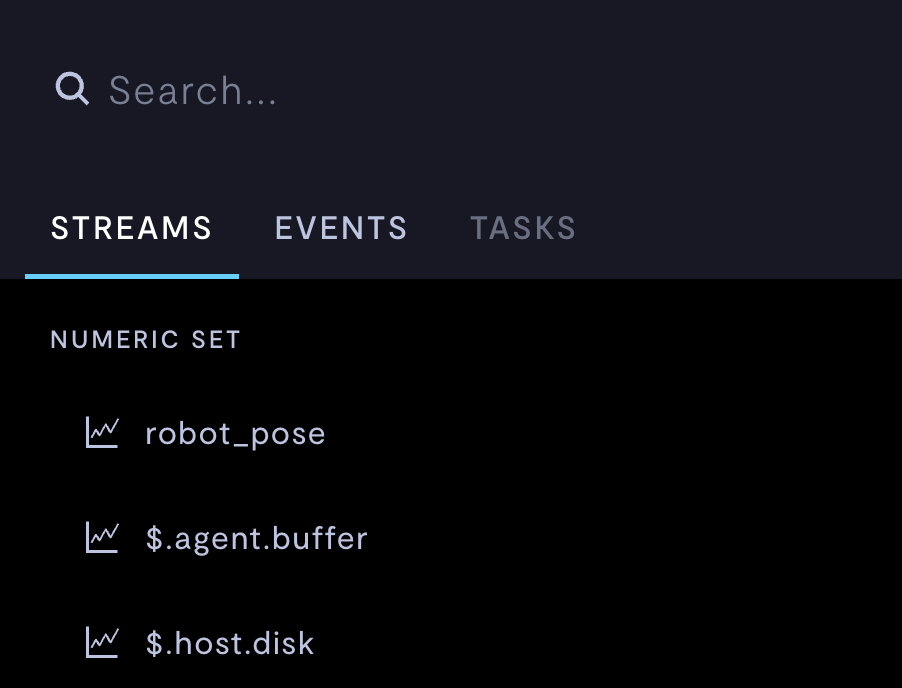
Selecting a data source.
Data which is stored as an asset is not available in Formant Analytics. For more information on datapoints and assets, see How telemetry streams work.
Data streams
You can plot and analyze data from individual streams on your device. Formant will chart historical data from the cloud for each individual stream.
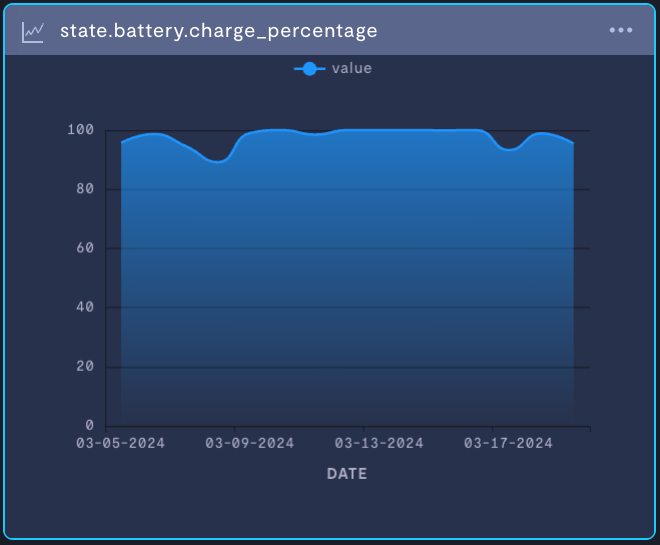
Basic data stream visualization.
Events
You can track events for a device by event type.
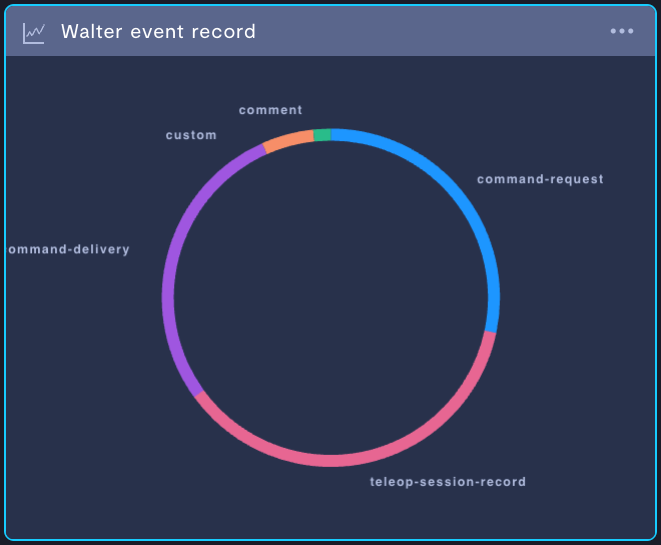
Tracking events by type.
Task summaries
You can upload compiled datasets for your devices in the form of task summaries. A task summary is a formatted dataset which describes a single event or a series of tasks, routines, or actions taken by your robot. A task summary can contain data from one or many streams.
You can upload new task summary formats, and task summaries in those formats, to Formant using the Task Summary API. For more information, see Task summaries.
Task summaries will appear on your device's timeline and events list.
If you notice an issue with this page or need help, please reach out to us! Use the 'Did this page help you?' buttons below, or get in contact with our Customer Success team via the Intercom messenger in the bottom-right corner of this page, or at [email protected].
Updated 5 months ago