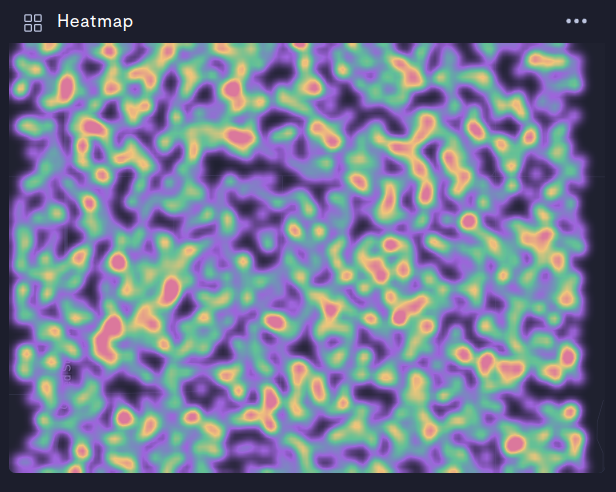
Heatmap module
The heatmap module allows you to visualize location data over a specified time range.

Location data in the heatmap module.
You can choose your time range for the heat map either between two events, between an event and the current position on the timeline, or in the time range of an existing annotation.
This guide will teach you how to add and configure a heatmap module in your device observability view.
Step 1: Create a heatmap module
- In Formant, navigate to the device view to which you want to add a heatmap module. You can do this by going to Settings >> Views and selecting the view you want, or by clicking on your device, going to the desired view, and clicking the dropdown arrow next to the view >> Edit... >> Edit Layout.
- In the Edit Layout window, click Add Module >> Heatmap.
Step 2: Configure your module
- Give your heatmap module a name, and click Open Configuration.
- Configure your module as follows:
Basic module configuration
| Parameter | Usage |
|---|---|
| Location data stream | Enter the name of the location stream you want to visualize. |
| Query data by | Choose an event, annotation, or timeline point to specify the time range for the heatmap. |
The way in which you configure your time range for the heatmap will depend on which value you select for Query data by.
Query by events
You can generate a heatmap of your robot's position between two events on the timeline, or over a set period of time before the occurrence of an event.
| Parameter | Usage |
|---|---|
| Time Range | Choose either a start event and end event, or an end event and a length of time before that event. |
| Start from | Choose either a length of time before the end event, or a start and end event to set your time range. |
| End Event Name | Name of the event at the end of your time range. |
Start from: Time Delta
| Parameter | Usage |
|---|---|
| Hours | Hours before the end event. |
| Minutes | Minutes before the end event. |
Start from: Event
| Parameter | Usage |
|---|---|
| Start Event Name | Name of the event at the start of your time range. |
Query by annotation
Annotations have built-in start and end times. You can set your heatmap to represent your robot's position over the time range described by an existing annotation.
| Parameter | Usage |
|---|---|
| Annotation Name | The time range defined by this annotation will be used to generate the heatmap. |
Query against active timeline point
You can query your robot's position between an event in the past, or a set amount of time, before the current position of the indicator on the timeline.
Start from: Time Delta
| Parameter | Usage |
|---|---|
| Hours | Hours before the current timeline position. |
| Minutes | Minutes before the current timeline position. |
Start from: Event
| Parameter | Usage |
|---|---|
| Event name | Name of the event at the start of your time range. |
Advanced settings
| Parameter | Usage |
|---|---|
| Mapbox access token | The heatmap is built on a Mapbox map. To use this module, first generate an access token from Mapbox, and then provide that token here. |
| Weight | Provide the name of a numeric stream. The size of the heatmap marker will scale to the value of the numeric stream specified. |
| Weight search window (s) | Max time window around location timestamp to search for a corresponding weight value in the numeric stream. |
| Longitude | Longitude of the center of your map. |
| Latitude | Latitude of the center of your map. |
| Default zoom level | Default zoom level from 1-24, where 1 is closest, 24 is farthest away. |
| Distinct zoom level | Zoom level at which the heatmap will fade away and show individual position datapoints. |
| Heatmap intensity | Integer between 1 - 20, it will make the map more dense based on the zoom level. |
| Circle heat radius (px) | Size of position datapoints on map. |
| Hover Tooltip Label | Labels to mark position datapoints on the map. |
When you've finished configuring your module, click Done and then Save.
See also
If you notice an issue with this page or need help, please reach out to us! Use the 'Did this page help you?' buttons below, or get in contact with our Customer Success team via the Intercom messenger in the bottom-right corner of this page, or at [email protected].
Updated 3 months ago
