
Create a view and add modules
A view is a data dashboard for your device. A view contains one or more modules. Each module is a data visualization for one or more streams from your device.
In Formant Coherence, you can place telemetry and analytics modules next to each other in the same view.
You can also follow the same workflow to build a view for a single device or a fleet of devices. Coherence modules can accept many data sources, such as a single video module displaying image streams from different cameras on different devices, or an analytics module reporting on many devices side-by-side with an active stream from a device.
This guide will teach you how to create a view in Formant Coherence and configure modules to visualize your device data.
Step 1: Create a view
- Navigate to the device for which you want to create a view.
- In the upper-right corner, click the plus (+) button >> Dashboard (v2 Beta) to create a new view.
View-level settings
You can configure settings for your view, which will apply to all modules in that view.
If you apply both view-level settings and module-level settings, the module settings will override the view settings for that particular module.
For more information, see the following section.
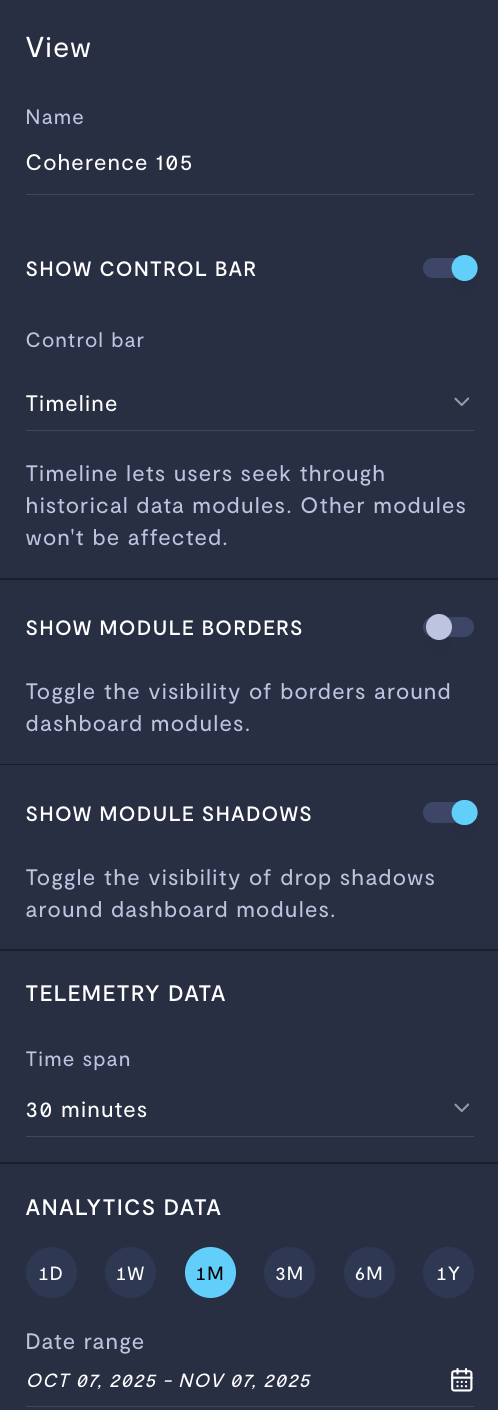
Configuring your view.
| View setting | Description |
|---|---|
| Name | Name for your view. This name will appear in the device header. |
| Group query scope (Group views only) | Sets the data scope for a group view.
|
| Show Control Bar | If ON, the end user will be able to use the control bar to interact with the view, through either a timeline or date picker. If OFF, the end user will only be able to see data from the time range you specify here (unless you override view settings with module-specific settings). |
| Show Module Borders | If ON, every module on the view will have a border, in a light-grey color. |
| Show Module Shadows | If ON, every module on the view will have a box-shadow, in a dark-grey color. |
| Control bar option | Description |
|---|---|
| Timeline | The end user will be able to navigate data via a timeline, seek to past data points or events, play back data, and control playback speed. |
| Date range | The end user will be able to navigate data via a static date picker with a defined start and end time. |
| Telemetry data view setting | Description |
|---|---|
| Time Span | If specified, all modules displaying telemetry data will only present data within the specified Time Span. If Control bar is ON and set to Timeline, this setting will always be set to Sync with timeline. If you also specify a Time Span at the module level, this setting will be overriden for that module. |
| Analytics data view setting | Description |
|---|---|
| Lookback range | If selected, analytics modules will display from the Lookback range (i.e., If you want to specify a time range for this view which does not end at the present time, use the Start date and End date controls. If you also specify a Lookback range at the module-level, this setting will be overriden for that module. |
| Start date | Start date for your analytics data query. If you also specify a Start date at the module level, this setting will be overridden for that module. |
| End date | End date for your analytics data query. If you also specify a End date at the module level, this setting will be overridden for that module. |
Step 2: Add modules
Once you've created a view, you will populate it with modules. Each module is a data visualization from one or more streams.
- In the upper-left corner, click Add (+) module.
- Select your visualization:
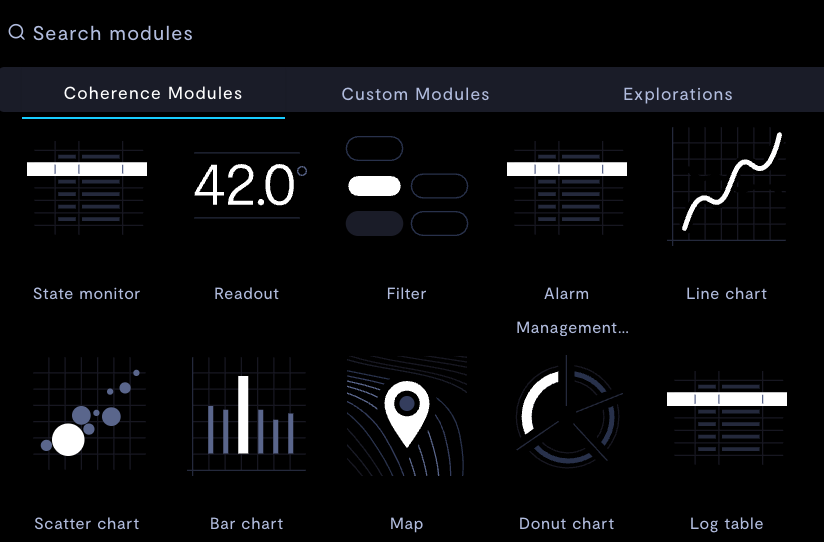
Module selector.
The following modules are available:
| Module | Description | Data mode | Valid data types |
|---|---|---|---|
| State monitor | View state of bits in a bitset. | Telemetry | Bitset |
| Readout | Display a single numeric value. | Telemetry, analytics, real-time | Bitset, numeric, text |
| Filter | Apply a tag filter to all modules in this view. | Telemetry | Tag selection |
| Line chart | Chart boolean and numeric data as a line. | Telemetry, analytics, real-time | Bitset, numeric |
| Button | Publish boolean data to a robot during teleoperation. | Teleoperation | Boolean |
| Scatter chart | Chart boolean and numeric data as individual datapoints. | Analytics | Bitset, numeric |
| Bar chart | Chart boolean and numeric data as a bar. | Analytics | Bitset, numeric |
| Map | Display location data on a map. | Telemetry | Location |
| Donut chart | Display ratios of values. | Analytics | Bitset, numeric |
| Log table | Display a table of values. | Telemetry, analytics, real-time | Bitset, JSON, numeric, text |
| Status table | Monitor a set of streams, and report a user-defined status based on their values. | Telemetry, real-time | Bitset, numeric, text |
| Video | Display real-time video or play back telemetry encoded video data. | Telemetry, real-time | Video |
| 3D Scene | Display a 3D rendering of your robot with localization, odometry, and point cloud data. For more information, see 3D Scene module. | Telemetry, real-time (each layer configured separately) | Location, occupancy, point cloud |
| Iframe | Embed an Iframe element. | N/A | URL |
| Static image | Display a static image file by providing a URL to the image. | N/A | URL |
| Image | Display a non-encoded image stream. | Telemetry | Image |
Configure real-time connectionsTo use a real-time data stream, you must first create a real-time connection to your device. For more information, see Set up real-time connections.
- Select a data source. You can select multiple data sources and display them in a single module.
Module-level settings
You can configure each module's time range and data presentation independently. If you configure the time range at both the view level and the module level, individual module settings will override view settings for that module. This allows you to create a view which presents short-term and long-term data from various sources side by side.
Telemetry module settings
| Module setting | Usage |
|---|---|
| Time span |
|
Analytics module settings
| Module setting | Usage |
|---|---|
| Sync with view | If ON, this module will defer to the View setting to set the time span. If OFF, you'll specify a Time span. This module will only present data in this time span, regardless of the view-level setting for Time span. If your view has a control bar, changing the time span on the control bar will not affect this module. |
| Fill date gaps | If ON, the x-axis of your visualization will show the entire time interval selected, whether data is present or not. If OFF, time intervals in your selection without data points will not be included in your visualization. |
See also
If you notice an issue with this page or need help, please reach out to us! Use the 'Did this page help you?' buttons below, or get in contact with our Customer Success team via the Intercom messenger in the bottom-right corner of this page, or at [email protected].