Default visualization types
Formant supports more than a dozen different robot data visualization types by default. This includes numerics, text, JSON, binary files, 3D data, location, localization as well as images and videos. Most data types from the robot can be mapped to one of these visualization types or can be converted using basic functions to map to the visualization type.
This section walks through the available visualization types and its definition in Formant.
Bitset
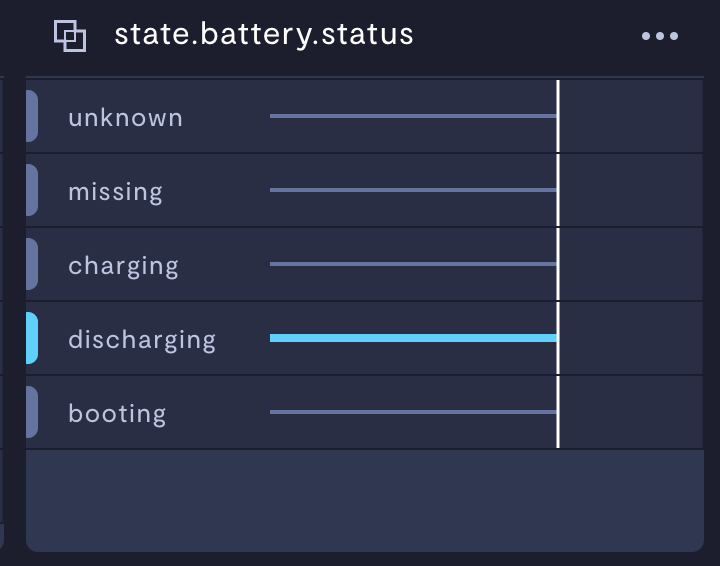
Bitset stores an array of bits (elements with only two possible values: 1 or 0, true or false). Bit states (1 or 0) are represented using a line graph and a color indicating the states.
-
True or 1
-
False or 0
A visual representation of five, bit keys is shown below. The bitset chart displays the current state as well as the recent historical state. The current state is also represented by the color on the left side of each bitset chart.
Battery
File
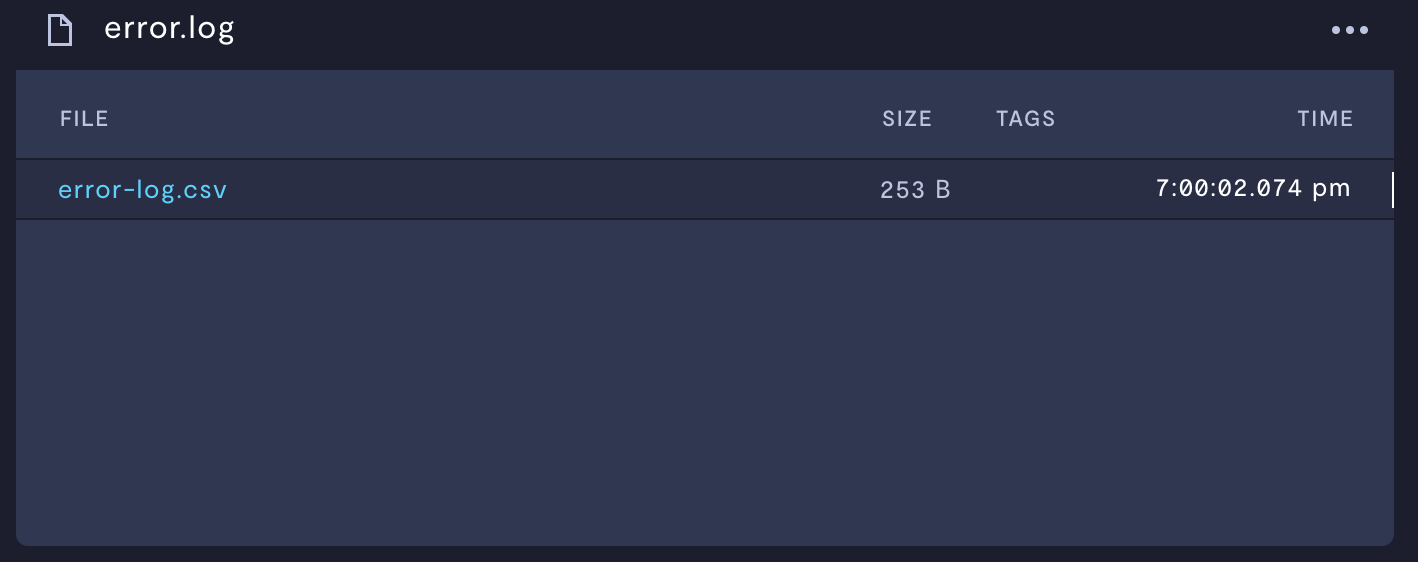
File visualization type contains file modules that can be downloaded from its visualization module by clicking on the file name.
Health
Health data shows the agent’s health state. This is typically used for agent's health data (which can be used to deduct general device health) and comes pre-defined from Formant.
The following image shows the health module when agent is online and operational.
The following image shows the health module when device is offline.
Image
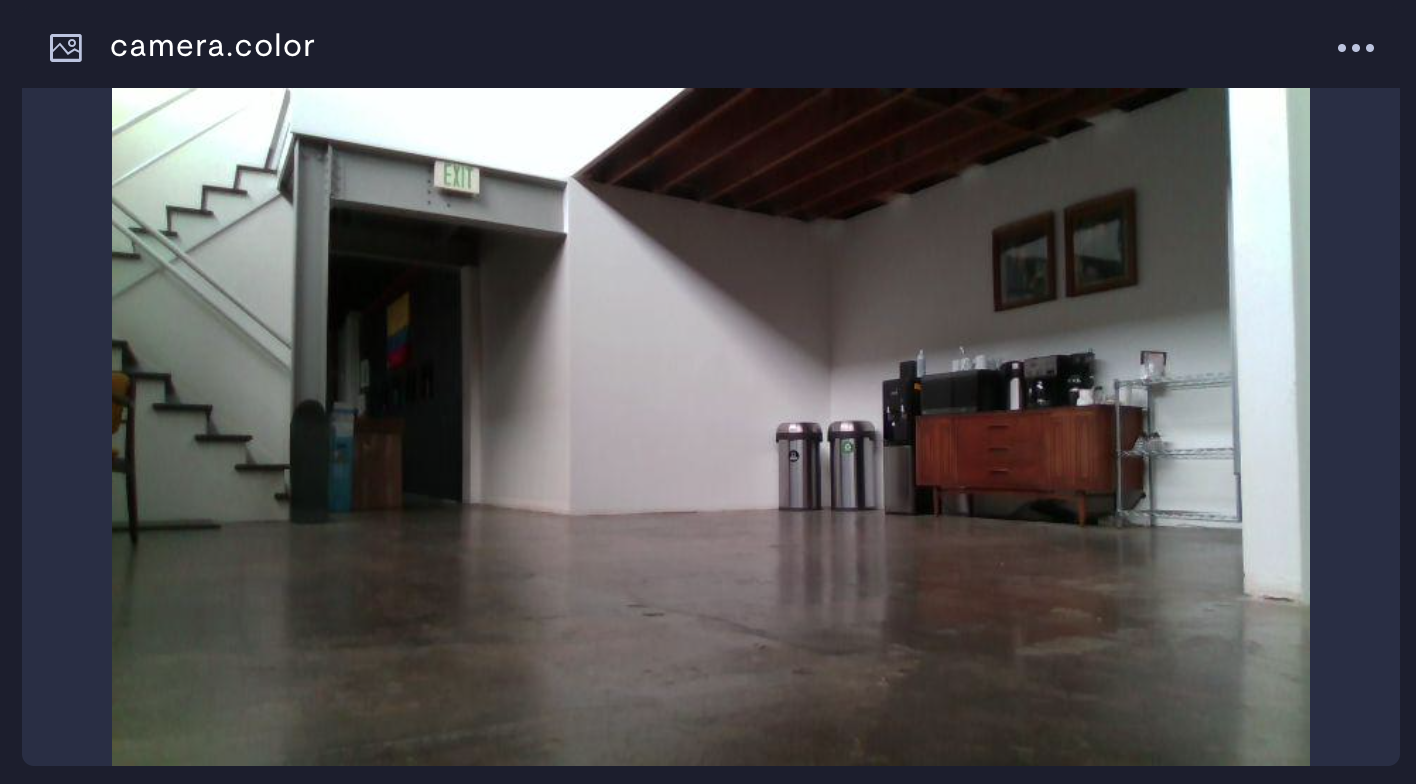
This visualization type displays image type data from the device.
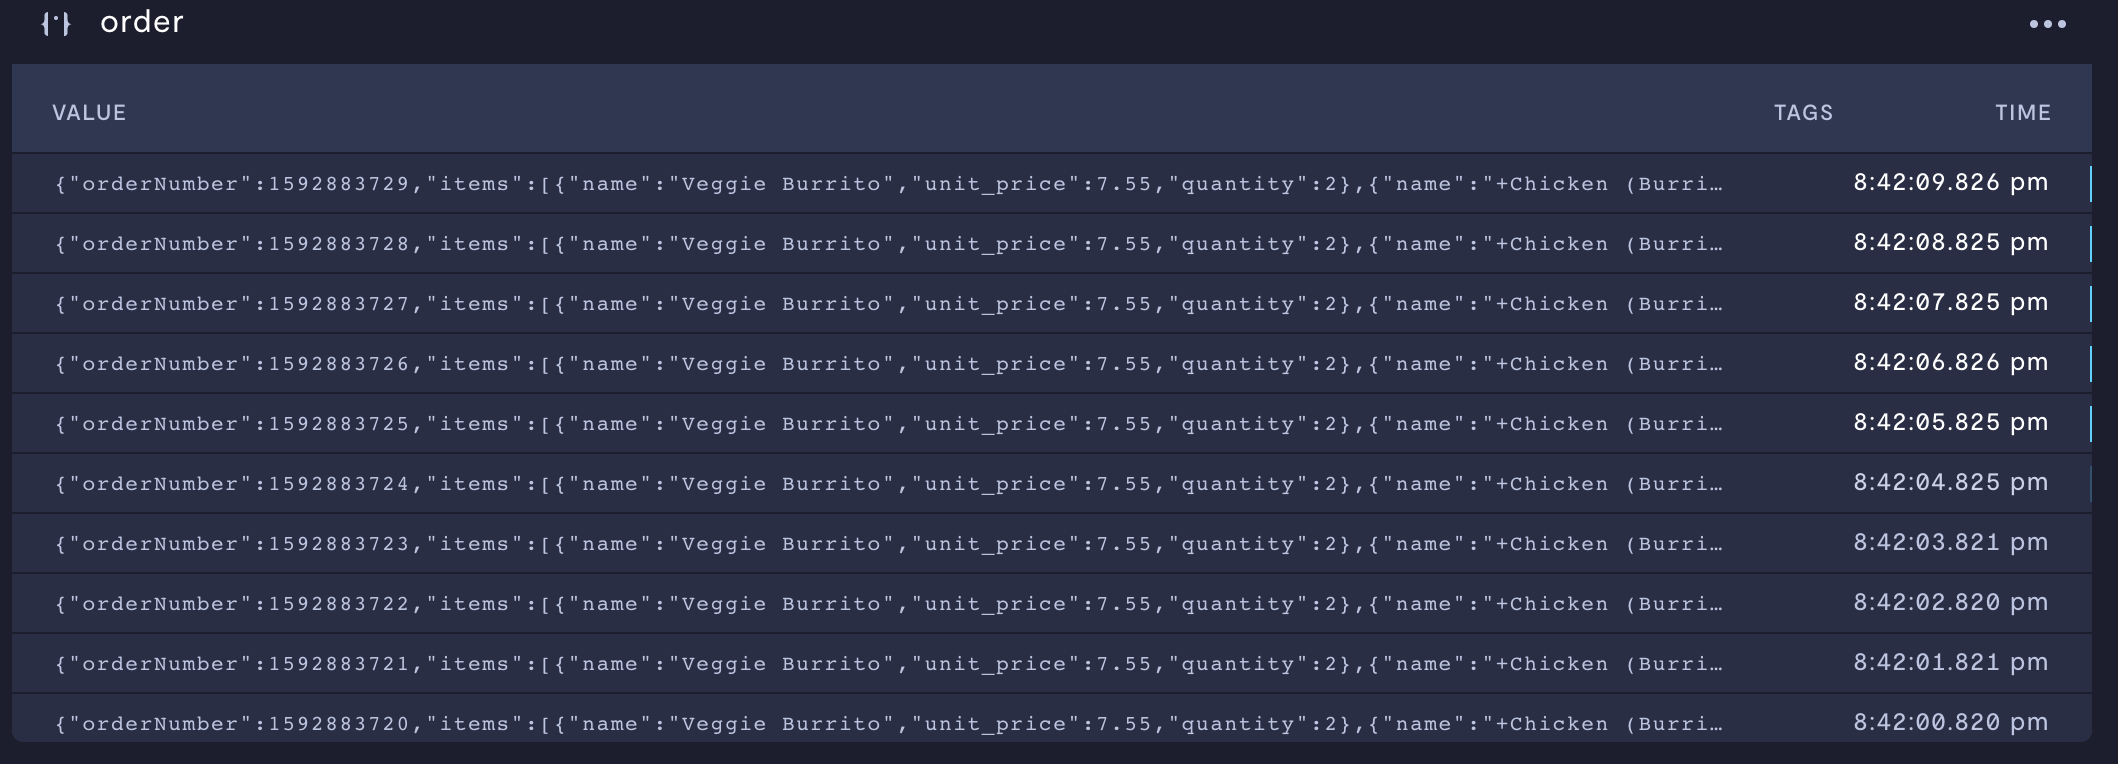
JSON
Each line of json displayed within the context of time.
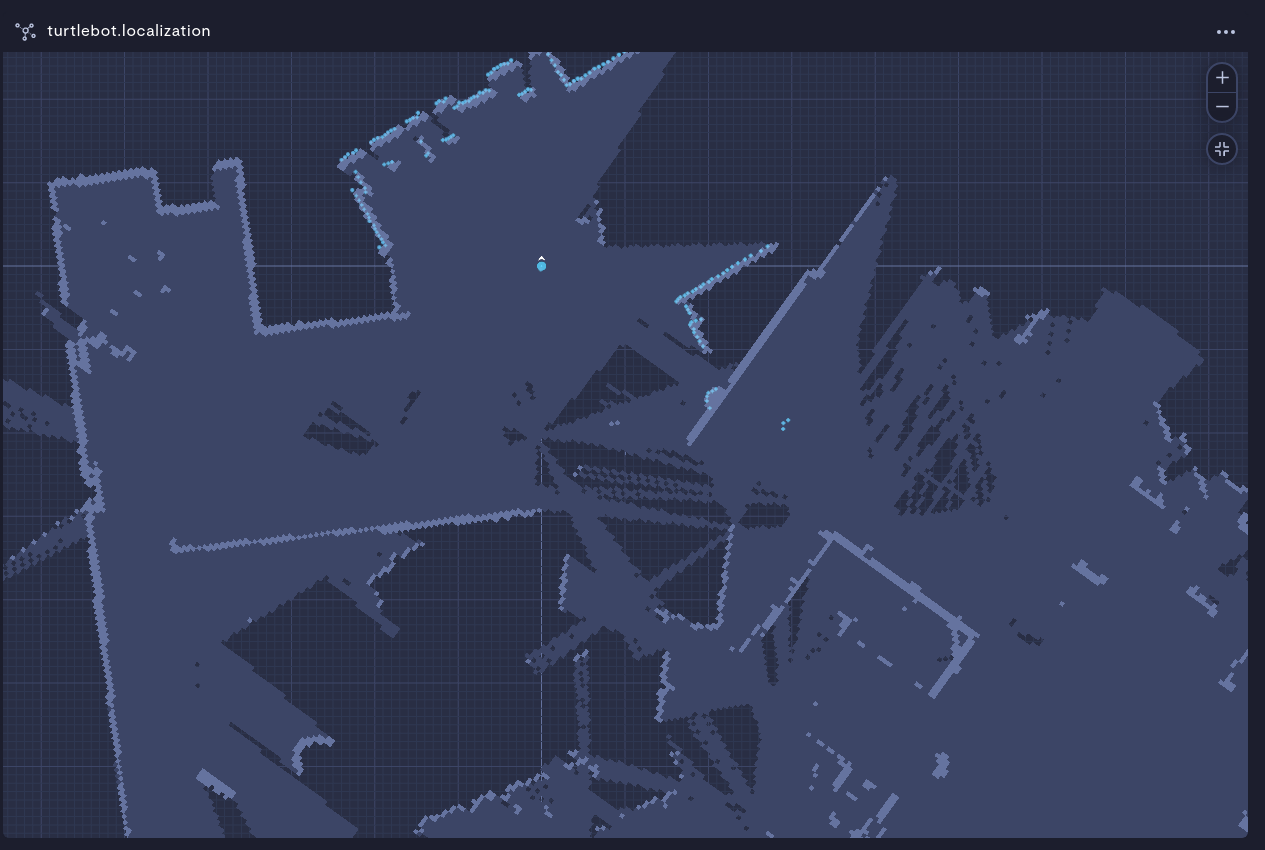
Localization
Visualize robot’s location with respect to its environment by ingesting odometry, map, point cloud, path and goal of the robot within a common world reference frame.
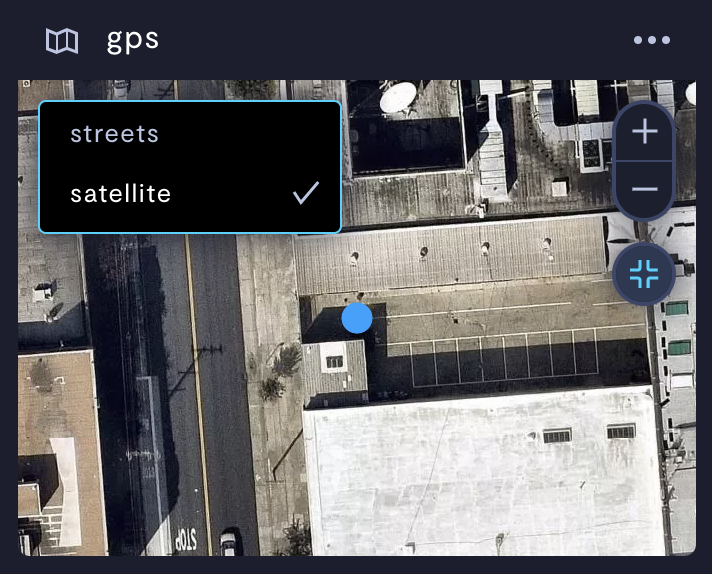
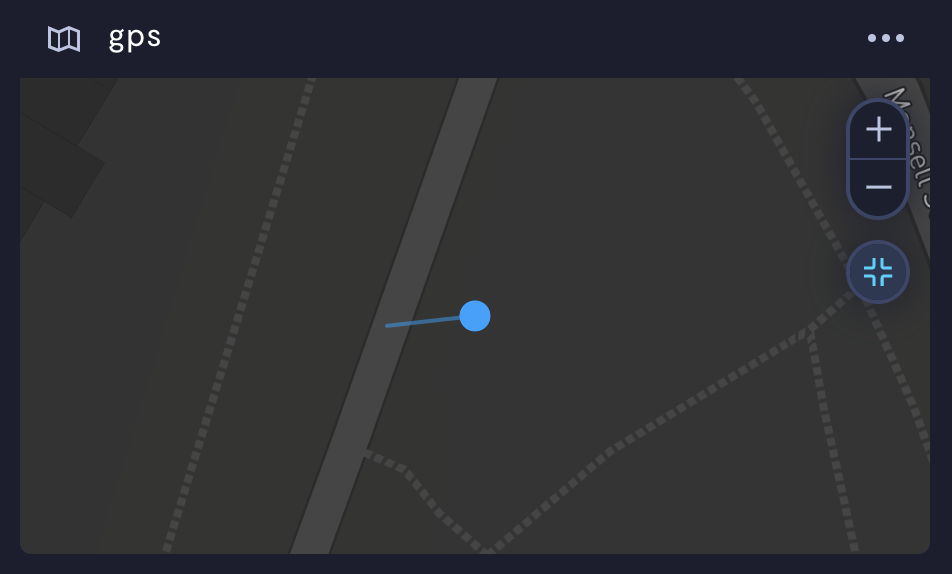
Location/GPS
Location/GPS coordinates of the robot. There are two modes that the user can choose from the drop-down menu - satellite view or street view.
Satellite view
Street view
Metrics
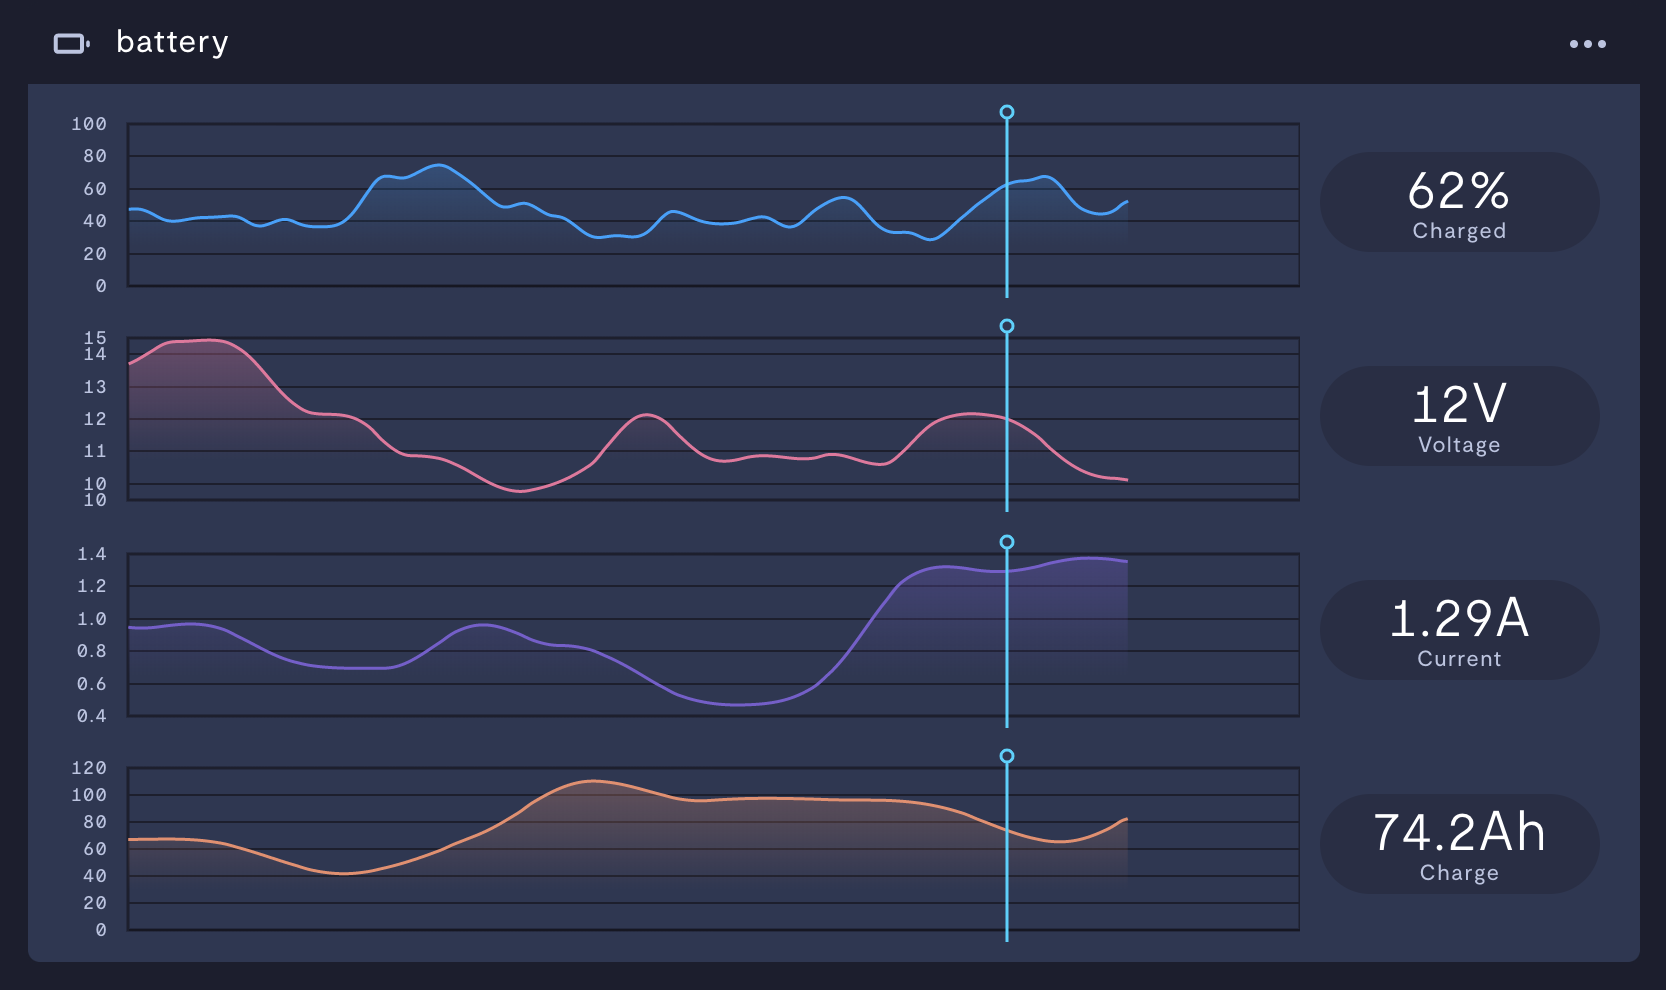
Sometimes it is useful to represent numeric data as a number with the current value, as opposed to within a chart with historic values. This module can be used to represent the same.
Numeric
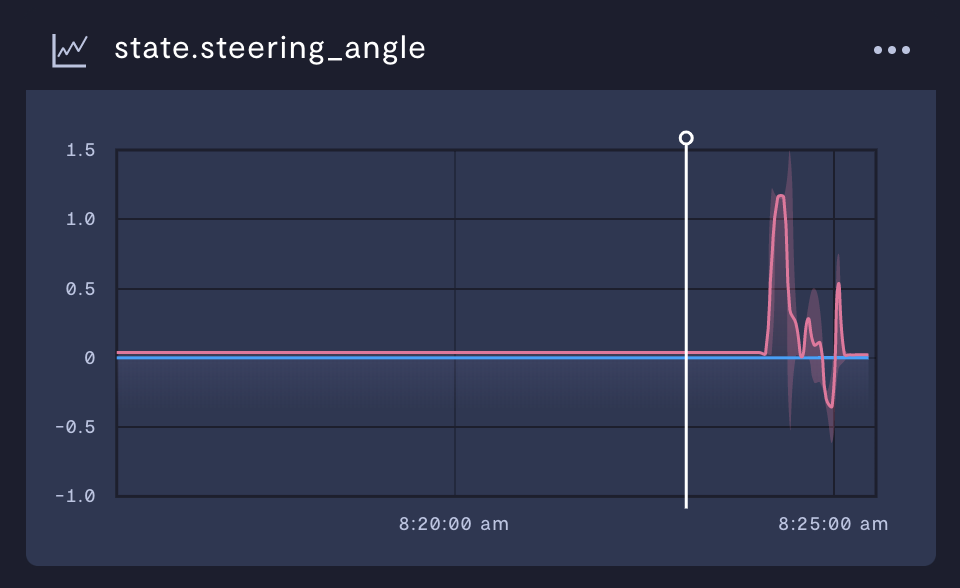
Numeric data represented on a line graph. You can configure numeric visualization modules to display one value or multiple values.
Point cloud
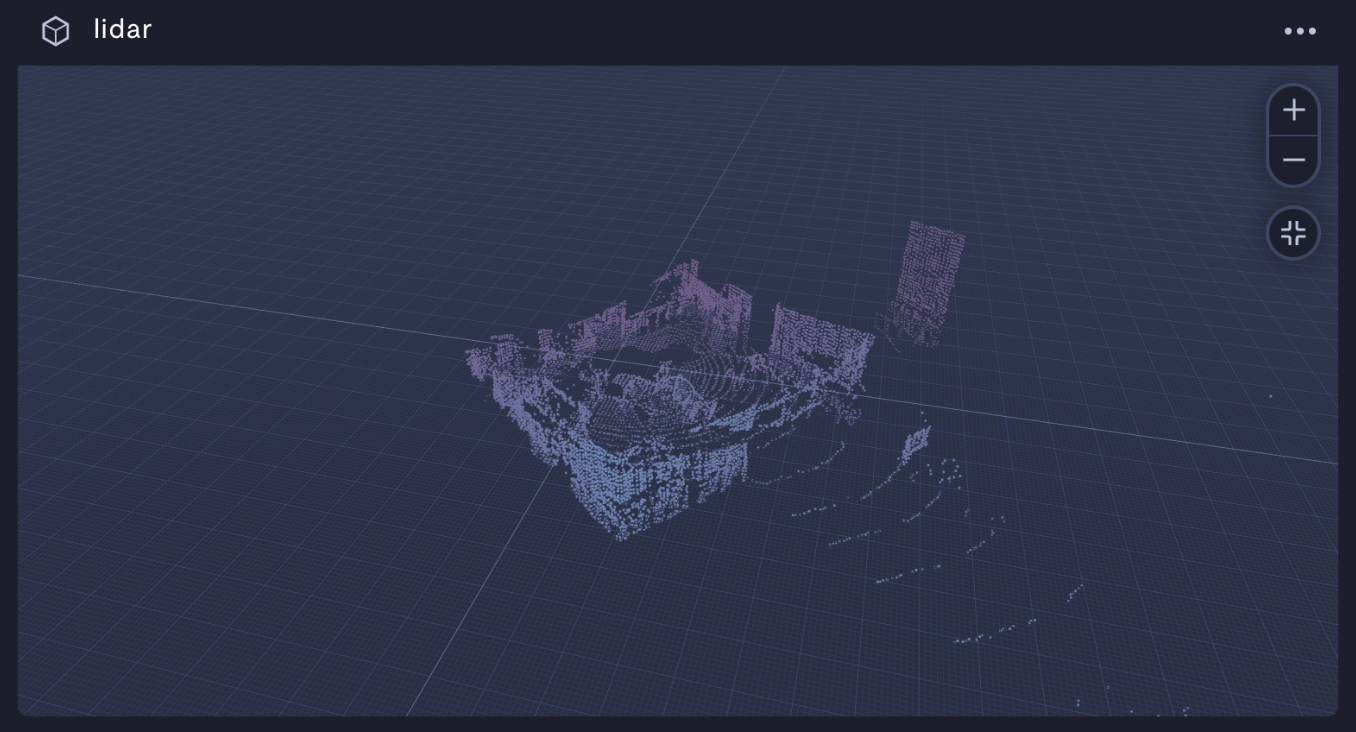
Point cloud (PCD format) or lidar data is supported for point clouds. The luminosity of every point is proportionally adjusted to the min/max intensity values from the data point. The lowest intensity is darkened by 50%, and the highest value is brightened by 100%, and everything else is adjusted linearly in between. Users can also zoom into, change the size of each point or revert back to the default focus by clicking on the respective icons. The focus can also be moved by right clicking on the map.
Text
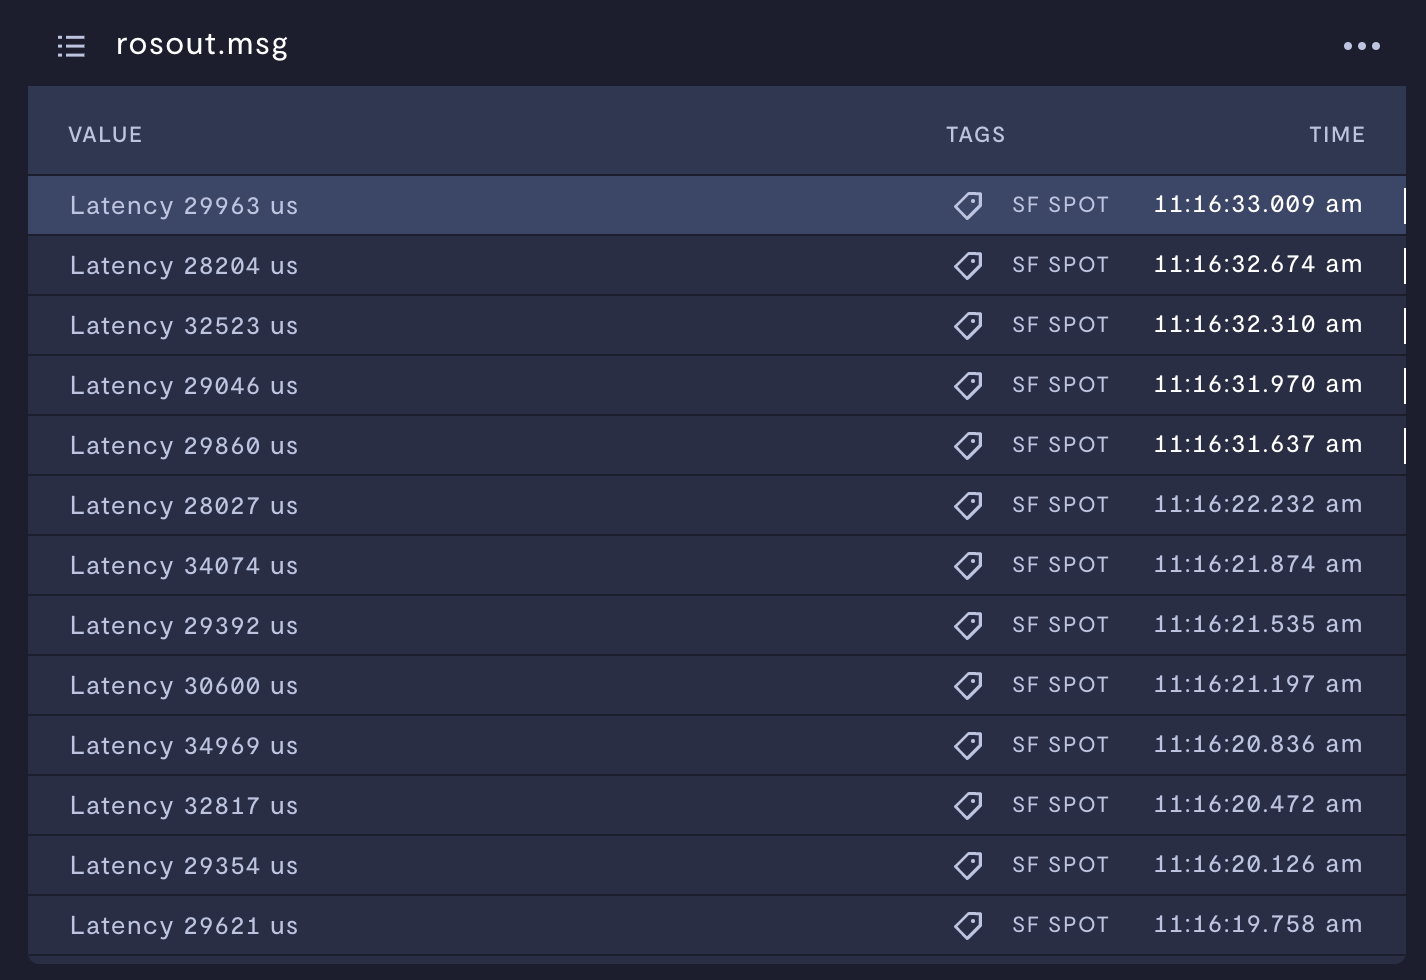
Each line of text data displayed within the context of time.
Transform tree
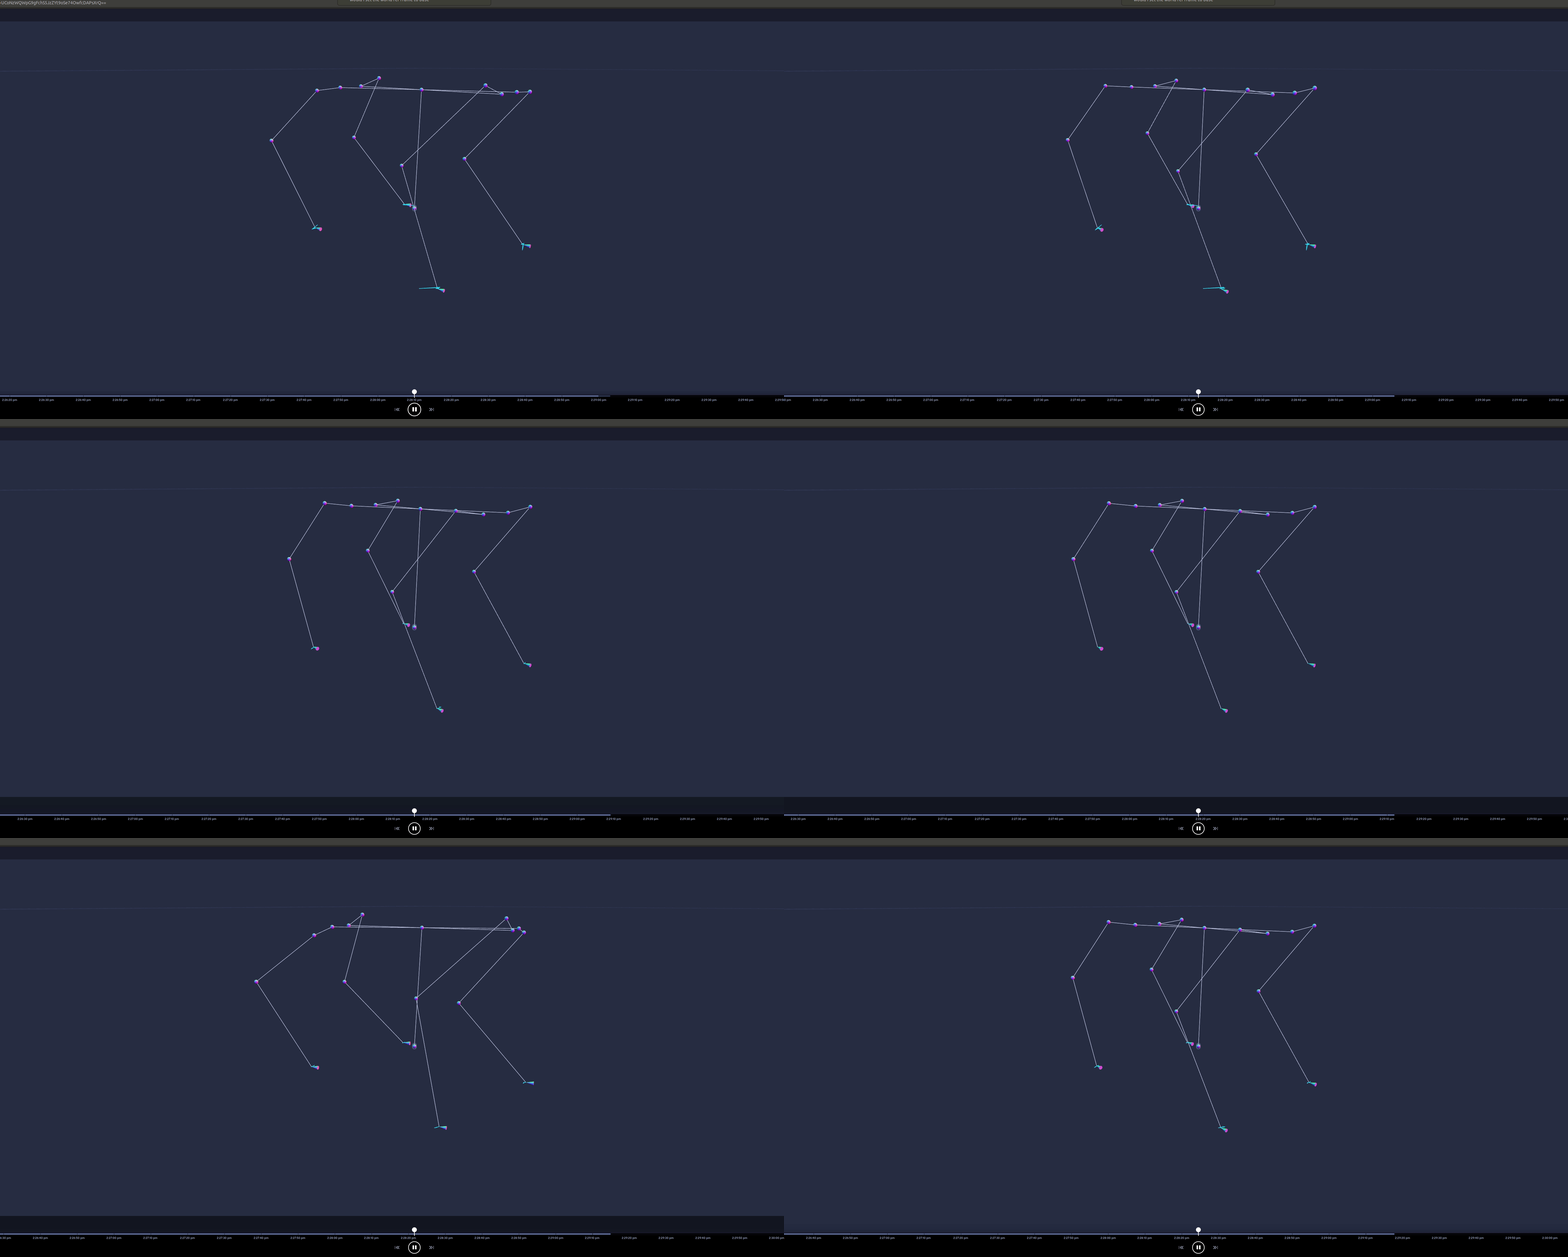
Visualizes the full tree of coordinate transforms - 3D coordinate frames that change over time, such as a world frame, base frame, gripper frame, head frame, etc. transform tree keeps track of all these frames over time and visualizes the same.
Updated 3 months ago
