
Heatmap overlay for the Map module
Visualize where a robot dwells or stops using the built-in heatmap overlay on the Map module.
Use the Map module heatmap overlay to visualize where a robot dwells or stops within the selected time window.
The Map module in Formant Coherence includes a built-in location heatmap overlay that shows where a device has spent the most time within the selected time window. It's useful for spotting where robots repeatedly stop, get stuck, or dwell across a site.
How it works
The heatmap is derived from the same location data the Map module already uses to draw the device marker and path. No separate query or stream configuration is needed. If a device's map shows a location marker, the heatmap toggle is available for it.
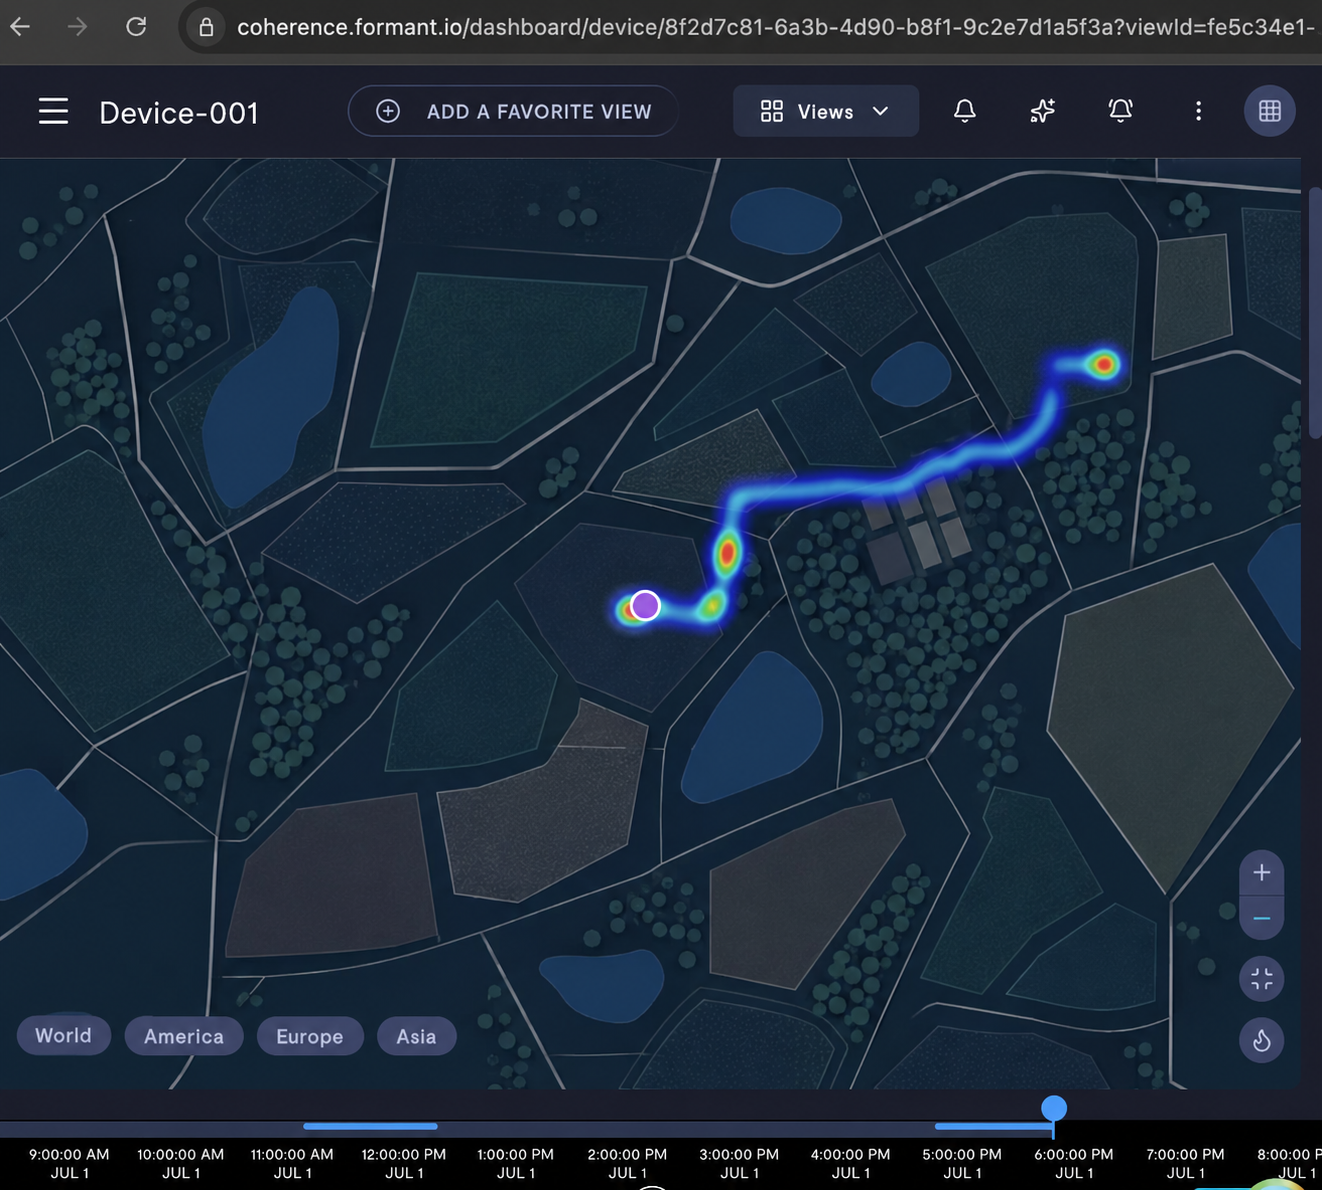
- Bright areas = dwelled. Locations the robot lingered in accumulate more samples and appear more intensely colored.
- Faint or absent areas = drove through. A location the robot only passed through once renders nearly transparent.
This makes the heatmap a stop/dwell indicator, not a raw GPS breadcrumb trail.
Turn on the heatmap overlay
The heatmap is off by default on every map.
- Open a view that contains a Map module.
- Confirm that the map shows location data for the device.
- Click the 🔥 button in the bottom-right corner of the Map module to toggle the overlay on or off.
Read the heatmap window
The heatmap reflects the currently selected timeline window, not the device's live position:
- The device marker always shows the robot's latest position.
- The heatmap aggregates samples from the selected time range only.
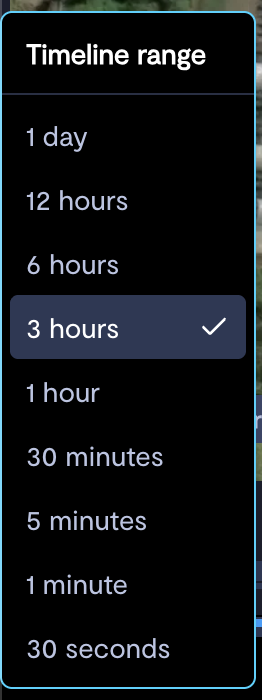
If the timeline window ends before the robot's most recent position, such as when you scrub to a past moment, the heatmap trail may stop short of the marker. This is expected. Widen the time window or go live to close the gap:
Works across organizations
The heatmap reads location data by its value shape, such as latitude and longitude, not by a specific stream name. This means it works regardless of what a given organization names its location stream.
Limitations
- The heatmap is a density-based dwell proxy, not a literal "obstacle stop" signal, but density tracks stops well in practice.
- Heatmap radius, intensity, and color are not configurable from the view editor.
See also
If you notice an issue with this page or need help, please reach out to us! Use the 'Did this page help you?' buttons below, or get in contact with our Customer Success team via the Intercom messenger in the bottom-right corner of this page, or at [email protected].
Updated 3 months ago